
How to Use Transportation Data Analytics to Stop Bleeding Money
One in five trucks on US highways is running empty.
Think about that. You're paying for fuel, drivers, and maintenance on trips that generate zero revenue. And empty miles are just the visible waste. The real damage is hiding in detention fees, idling time, and billing errors you never catch.
Last year, US logistics spending hit $2.58 trillion. That's 8.8% of GDP. In an industry where margins live in single digits, this level of waste is inefficient and existential.In a booming market, you could get away with it. Revenue covered the gaps. But that buffer is gone. You've already squeezed suppliers and cut overhead.
There's no fat left to trim. The only remaining lever is data. Specifically, using the data you already have to find and eliminate the waste you can't see. That's what transportation data analytics actually does.
Why Traditional Cost-Cutting Stopped Working

For decades, the logistics playbook for a downturn was simple: squeeze suppliers, negotiate harder with carriers, cut overhead. Repeat until profitable.
That playbook died in 2023.
We're in year two of a severe freight downturn. Demand is at historic lows, which has destroyed your pricing power. But your costs? Fuel, labor, insurance, all still climbing. You're earning less per mile while paying more to drive it.
And the easy fixes are gone. You've already optimized procurement. You've cut headcount. There's no fat left. Cut any deeper and you're damaging service levels and losing customers.
The market is brutal right now. By the end of 2024, there were 3,104 fewer freight brokerages than the year before. Add that to the 2,395 that closed in 2023, and you're looking at 5,409 companies that didn't make it between January 2023 and December 2024.
Meanwhile, 90% of logistics leaders now report directly to the C-suite. You're not just being asked to survive, you need real-time dashboards, sustainability reports, and contingency plans for every possible disruption.
This creates a weird paralysis. Leadership tells you to innovate, but your internal metrics still reward the old playbook: minimize cost-per-mile at all costs. Even when that strategy is what's killing you.
Here's what changed: When you can't raise prices and you can't cut costs any further, the only way to protect your margin is to find and eliminate hidden waste. Not the obvious stuff, the invisible leaks. Empty miles. Billing errors. Idling trucks burning fuel for zero movement.
Analytics is the only tool that can see those problems. And in a market this tight, seeing them is the difference between profit and closure.
The Data Sources to Start Using
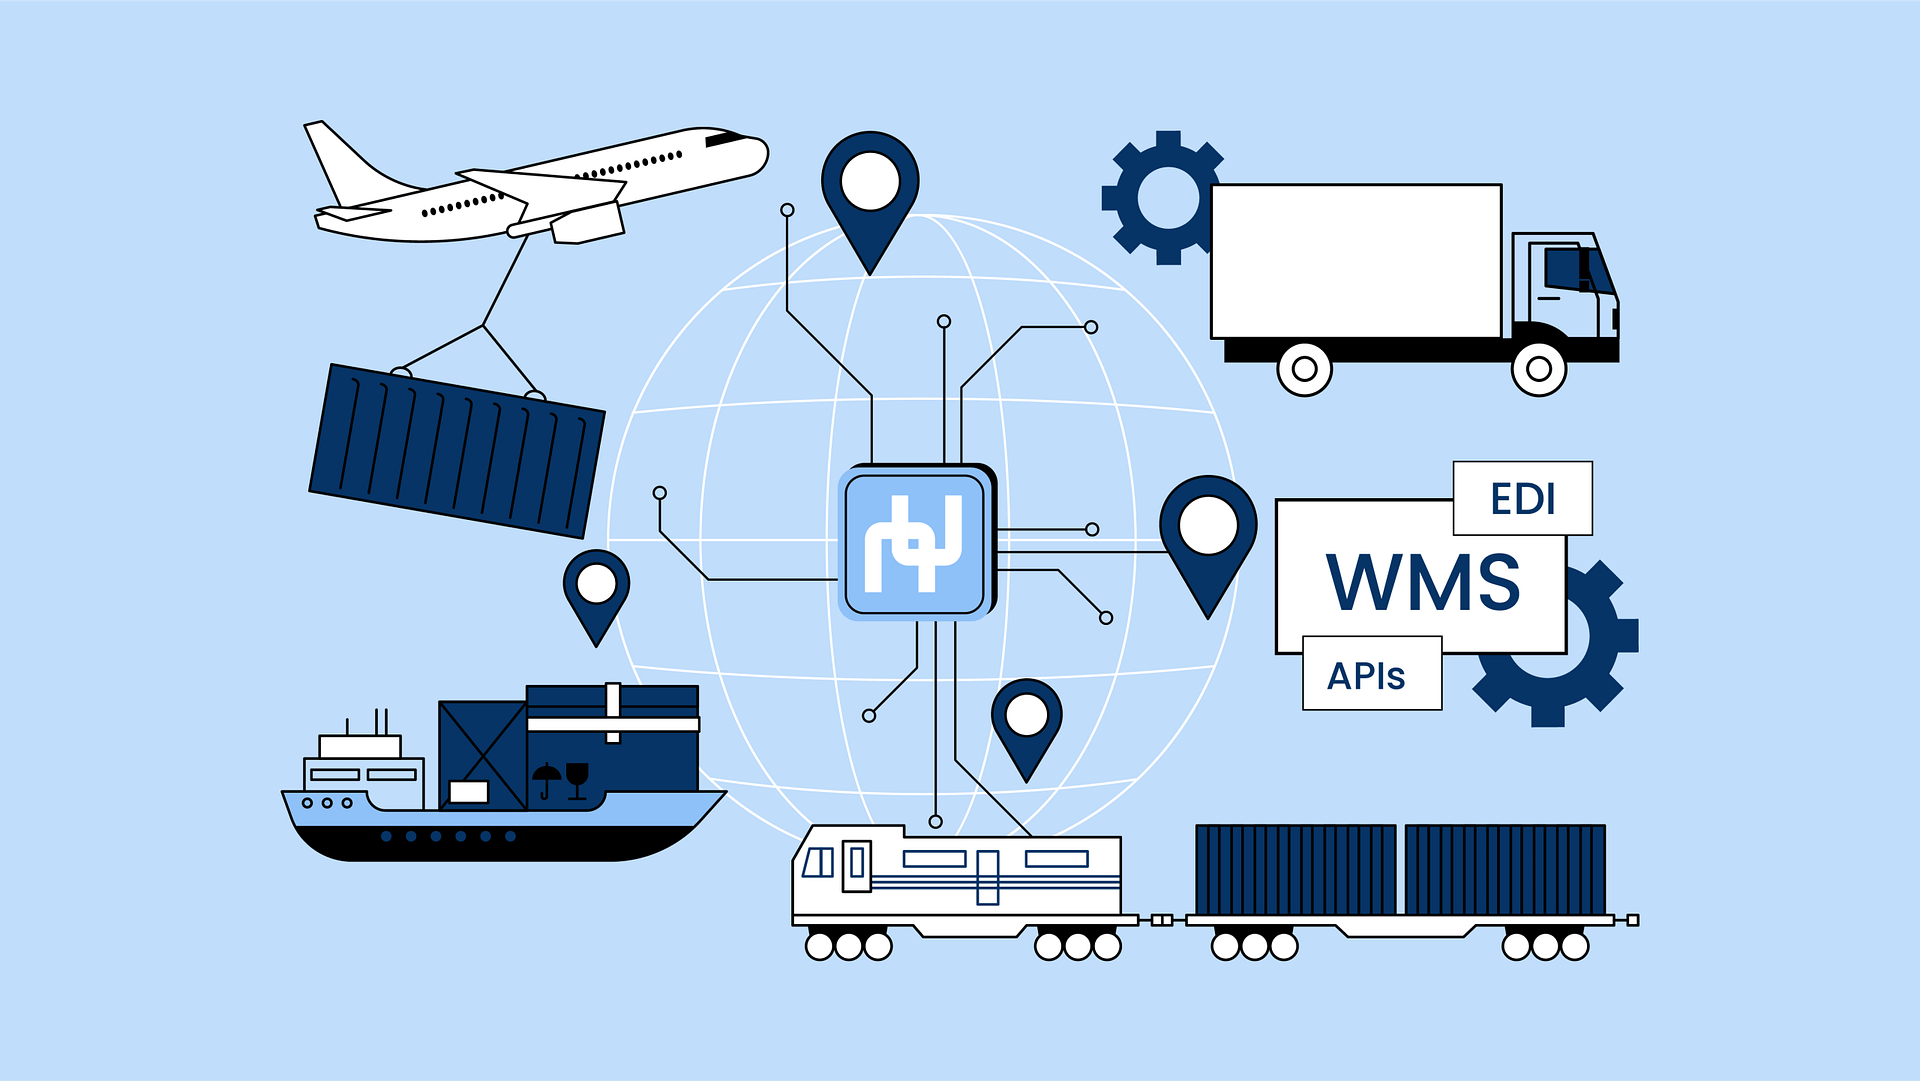
The good news is you probably don’t need to buy new data. Most operations already generate it and the issue is that it sits in different places. Modern analytics platforms can pull these feeds together quickly through APIs, EDI, or basic file uploads.
Every delay, extra mile, empty move, or stockout leaves a trace somewhere in your ERP, rate sheets, carrier portals, emails, or telematics. Transportation data analytics connects those traces and follows them back to problems you can actually fix.
Even better: you do not need a perfect tech stack to start. Whether your systems are modern, legacy, or somewhere in between, an integrated platform can pull these feeds together quickly through APIs, EDI, ELD integrations, IoT partners, or basic file uploads. Once connected, everyday operational breadcrumbs become clear signals.
Here are the three data streams that, once unified, reveal exactly where your margin is leaking.
1. Fleet Behavior Data (Telematics)
Your trucks are already tracking GPS routes, engine diagnostics, and driver behavior. Most companies use this data for one thing: location tracking. That's it.
But there's more hiding in there. Specifically, the behaviors that are burning your cash:
- Idling. A truck sitting idle burns about half a gallon of fuel per hour. Across a fleet, that adds up to thousands of dollars burned for zero movement. Just... burning.
- Driving patterns. Harsh braking and speeding don't just kill fuel efficiency. They predict maintenance failures and accidents before they happen.
- Route drift. When drivers deviate from the optimal path, unnecessary miles pile up fast.
Most companies export this data manually into CSV files and try to make sense of it in Excel. It doesn't work. By the time you've spotted the pattern, the damage is done.
Better systems tap directly into the telematics stream and feed it into optimization algorithms in real time. Neurored TMS & SCM connects with 600+ ELD manufacturers and provides real-time visibility into 8.5 million trucks worldwide.
That means you can recalculate routes based on actual GPS tracking and route adherence data, not theoretical maps drawn by someone who's never driven a truck.
2. Process Flow Data (WMS + TMS Integration)
Here's a scenario you've lived: A delivery is late. The customer is furious. Who screwed up?
Without integrated data, you can't tell. Was the warehouse slow? Was the carrier late Was the yard backed up?
Everyone points fingers. No one can prove anything.
When you connect your Warehouse Management System (WMS) to your Transportation Management System (TMS), you create a unified timeline:
- Was the order ready? Timestamp the warehouse release.
- Did the carrier show up? Timestamp the gate check-in.
- Was the yard congested? Timestamp the container exit.
Now you can see the exact chain of events. No more blame games. Just facts.
This is where legacy systems fall apart. Once you start tracking every handoff and every timestamp, old-school integrations struggle. They rely on custom builds that take months and still leave gaps whenever something changes. With so much granular data moving through the flow, the cracks start to show fast.
Neurored TMS & SCM avoids all of that by running natively on the Salesforce platform. Uptime stays high, the infrastructure is rock solid, and integrations feel like quick configurations instead of long IT projects. With every event captured and no missing data from downtime, you always see the full sequence of what happened.
‣ Learn more about the advantages of a Salesforce-native TMS for your company
3. Cargo Condition Data (IoT Sensors)
Temperature, humidity, vibration, IoT sensors track all of it now.
In a booming market, you might write off spoilage as the cost of doing business. When freight demand is low, you can't afford that loss.
Here's the shift: Instead of discovering spoilage at the destination (too late), you detect temperature spikes mid-transit and intervene before the load is ruined.
When you integrate sensor data directly into your shipment records alongside carrier performance, you can analyze which lanes, carriers, or seasons carry the highest risk.
That gives you the leverage to negotiate premiums or change routes before you lose another load. Neurored TMS & SCM's IoT Device Monitoring continuously tracks temperature and humidity for perishable and fragile goods, while Supplier Performance Management provides detailed scorecards tracking carrier price, responsiveness, efficiency, and quality.
Combined with Supply Chain Risk Management features that monitor credit exposure and operational challenges, you get complete visibility to make data-driven routing and carrier selection decisions.
The 4 Tiers of Transportation Analytics

Think of transportation analytics as a ladder. Most companies are stuck on the bottom rung, staring at what went wrong last month. The companies thriving when freight demand is low are the ones predicting problems and fixing them before they cost money.
Let's climb this ladder together. Each rung represents a different level of operational maturity.
Tier 1: Descriptive (What Happened?)
This is your baseline. Dashboards showing cost-per-mile, fuel efficiency, on-time delivery rates. Basic stuff.
You can't optimize what you don't measure, so this tier is non-negotiable. But here's the problem: In a fast-moving market, relying only on Tier 1 is like driving with just your rearview mirror. You see the pothole after you've already hit it.
Most companies build these reports manually. Someone exports data from three different systems, pastes it into Excel, and emails a PDF to leadership every Monday. By the time anyone sees it, the damage is done.
Modern transportation analytics systems automate this completely, processing real-time feeds from multiple sources simultaneously. Neurored TMS & SCM, for example, auto-generates operational KPIs the moment you connect your data sources. You get the baseline dashboards out-of-the-box, which frees you up to focus on the predictive stuff.
Tier 2: Predictive (What Will Happen?)
This is where you stop bleeding cash on avoidable problems.
Predictive analytics uses your historical data and real-time telematics to forecast failures before they happen. A truck component is likely to fail? You get flagged three days before it leaves a driver stranded on a highway. A shipment is trending late? You know before the customer calls to complain.
The shift here is from reactive firefighting to proactive maintenance. Instead of scrambling to fix disasters, you're preventing them.
The best transportation analytics systems run machine learning models on your telematics data continuously, analyzing patterns across millions of shipments to predict exceptions before they occur.
Tier 3: Prescriptive (What Should We Do?)
Knowing a problem is coming is useful. Knowing how to solve it is better.
Prescriptive analytics balances competing constraints (cost, speed, emissions) and recommends the optimal course of action.
It answers questions like: "Given these 47 orders, current traffic patterns, and our carrier contracts, what's the cheapest, fastest, most sustainable route?" Your dispatcher can't calculate that manually, there are too many variables. But algorithms can.
This is where Salesforce Einstein AI, built into Neurored TMS & SCM, comes in. Einstein AI understands your data and gives you specific recommendations. The key advantage? It leverages the work already done in the previous two tiers, the descriptive metrics showing what happened and the predictive forecasts showing what will happen.
Einstein AI analyzes this existing data to tell you what to do about it. Should you shift inventory to a different warehouse? Einstein AI spots the demand pattern before you run out. Which carrier should handle tomorrow's surge? The system recommends options based on historical performance and predicted conditions.
You're not starting from scratch with each decision. Einstein AI uses the data your system has already collected and analyzed, turning insights into action.
Tier 4: Cognitive (Full Automation)
This is the frontier. The system recommends and acts.
Think digital yard management where trucks are routed automatically based on real-time congestion, or procurement systems that execute spot buys when rates hit predefined thresholds.
Neurored TMS & SCM has a growing suite of AI agents that learn your business rules and gain your trust over time:
- AI Quoting Agent drafts optimized freight quotes in seconds from simple inputs, operators review and approve before sending to customers
- AI Payables Agent converts invoice PDFs into structured data and auto-matches to TMS fees, finance teams review exceptions before payment
- AI Assistant Agent answers operational questions like "What's our detention policy for Carrier X?" by reasoning over your company documentation and historical data
- AI Rate Assistant identifies rate file changes and column mismatches, CSMs review and approve script updates
- Road AI Pricing Agent automates customer dialog to launch pricing for road transport orders, pricing teams validate before execution
The path to full automation isn't flipping a switch, it's earning confidence through repeated accuracy. These AI agents operate in co-pilot mode: they handle the repetitive heavy lifting while your team verifies outputs and handles edge cases.
As you build trust in the recommendations and exception rates drop, you can progressively automate more decisions.
The companies adopting these tools today are building the muscle memory and data foundations that will let them automate tomorrow. And in a market where every dollar and hour matters, that's the difference between scaling operations and drowning in spreadsheets.
Avoid These Traps in Transportation Analytics Projects

If analytics can catch these problems, why doesn't everyone use it?
Here's the painful truth: 76% of logistics analytics projects fail. Not because the technology doesn't work. They fail because the organization wasn't ready to use it. That’s why we’ve prepared the three most common traps companies fall into so you can be ready.
Trap 1: The Data Silo Problem
95% of companies struggle to integrate data across legacy systems because of siloed, messy, and incomplete data. This is the fundamental challenge of big data analytics in transportation: you're generating terabytes of operational data monthly, but if it lives in disconnected silos, you can't extract value from
Here's what that looks like in practice: Customer data lives in Salesforce. Shipment data lives in your TMS. Fleet data lives in your telematics platform. Invoicing data lives in QuickBooks. None of these systems talk to each other.
When your data sits in isolated pockets, you can't build useful models. You spend all your time just cleaning up the mess. Data scientists report spending 45% of their time on data preparation, like cleaning and ingesting, instead of building anything that generates value.
The algorithms starve. They can't see the whole picture, so they can't give you useful predictions.
This is why point solutions don't work long-term. You bolt on a new tool, but it can't access half the data it needs. Eventually, someone gives up trying to maintain the integration, and the project dies quietly.
The fix: Centralized platforms that unify data from the start. When everything lives in one environment, you stop spending time finding the data and start spending time using it.
Trap 2: Culture Kills Adoption
This is the most common failure mode. Leadership mandates a new system. The team resists. The project dies.
Here's how it plays out:
Your CEO buys a fancy new transportation analytics platform. Announces it in an all-hands meeting. We're investing in big data analytics in transportation," leadership declares. "This will revolutionize our operations.
The data flow dries up. The dashboards stay empty. Six months later, leadership quietly abandons the project and writes off the investment.
The mistake? Leaders imposed the tool by directive rather than design.
Here's what works: Involve frontline users in the prototype phase. Let them test the interface before rollout. When a driver says, "I can't use this with gloves on," fix it. When dispatchers say, "This adds three steps to my workflow," redesign it.
When your team feels ownership over the tool, they'll actually use it. When they feel like it was forced on them, they'll sabotage it, consciously or not.
This is why the Neurored’s Truck Driver Mobile App (DriversON) has configurable workflows. You can prototype a dispatch process, let drivers test it on their phones, and revise based on real feedback. By the time you go live, your team is already bought in because they helped build it.
Trap 3: The Trust Gap
Some logistics companies may find it tough to find proper analytics talent. And when they do find someone, there's often a translation failure. The data scientist speaks machine learning models and confidence intervals. The operations manager speaks trucks.
Result? Operators ignore the insights.
Here's a real example: Your data scientist builds a predictive maintenance model <mark>using big data analytics techniques. It's sophisticated. It works. The transportation analytics model flags a truck component for repair on Monday.
But your maintenance manager has been doing this job for 20 years. He trusts his gut more than some black box algorithm. He ignores the alert.
On Wednesday, the truck breaks down on the highway. Costs you $8,000 in emergency repairs and a missed delivery. The model was right. The project still failed because the team didn't trust the machine.
The fix isn't better algorithms. It's better proof.
You need to show results in language that operations managers respect: dollars saved, downtime prevented, customers retained. Not correlation coefficients or model accuracy scores.
That's where a balanced scorecard comes in.
Three Layer Transportation Analytics Scorecard

No executive invests in transportation data analytics projects based on feelings. They invest in proof. When you're asking for a budget to process millions of data points across your network, you need metrics that directly tie analytics investments to financial outcomes
Here's the problem: Most companies track vanity metrics. On-Time Delivery looks good on a dashboard, but it doesn't tell you why deliveries are late or how to fix it. It measures symptoms, not causes.
Analytics reframes performance around cause and effect. You need a robust scorecard that tracks health across three dimensions: Financial, Operational, and Human.
Let me explain what that means.
1. Financial Health (The Result)
These are the numbers that defend your budget to the CFO. When leadership asks, "Why should we keep funding this?" These metrics answer.
- Cost per Ton-Mile: The ultimate efficiency measure. Are you moving more freight for less money? If this number is rising, something upstream is broken.
- Freight Invoice Accuracy: How often are you overpaying carriers because of billing errors? Automated auditing should drive this to near 100%. Every invoice error is pure waste.
- Maintenance Cost Reduction: The direct financial output of predictive maintenance. When you stop doing emergency repairs and start doing scheduled maintenance, this number drops hard.
2. Operational Health (The Cause)
These metrics diagnose why your financial numbers are moving. When cost-per-mile spikes, you look here to find out what broke.
- Asset Utilization: The percentage of trucks running full vs. running empty. Remember that opening stat? One in five trucks runs empty. In a recession, empty miles are killing your business.
- Truck Turn Rate: Time from gate entry to exit. This measures yard efficiency. A clogged yard means late pickups, which means angry carriers, which could mean higher rates next contract.
- Mean Time Between Failures (MTBF): How long your trucks run before something breaks. This is a predictive metric. When MTBF drops, you know failures are coming before they happen.
3. Human Health (The Sustainability)
Logistics runs on people. If these numbers drop, everything else follows.
- Driver Turnover: High turnover kills institutional knowledge. It also spikes recruiting costs. Training a new driver costs $8,000 to $12,000. Lose ten drivers and you've burned $100k before your new team can make their first delivery.
- Customer Retention: It's far cheaper to keep a customer than find a new one. Especially in a down market where everyone is fighting for the same shrinking pool of business.
- Employee Satisfaction: The leading indicator of turnover. When satisfaction drops, people start looking for other jobs. By the time turnover spikes, it's too late to fix.
Here's how this works together: Your financial metrics tell you if you're profitable. Your operational metrics tell you why or why not. Your human metrics tell you if it's sustainable.
Most companies only track the first category. They see profit dropping and panic. But they can't diagnose the root cause because they're not measuring operations or people.
Track all three, and you can actually fix problems instead of just watching them happen.
Tips for Analyzing Your Transportation Data

You don't need a huge budget or a multi-year transformation project. In fact, the "big bang" approach usually fails because it tries to do too much too soon.
Here's what works: Start small, prove value, scale.
Step 1: Pick One Problem
Don't try to fix everything. Pick your single biggest pain point right now.
Is it fuel costs? Late deliveries? Detention fees? Empty miles?
Choose one. Focus your entire initial effort on that single variable. Ignore everything else for now.
Step 2: Connect the Minimum Data
If you picked fuel costs, start with telematics. If it's late deliveries, connect your WMS to your TMS. That's it. Don't try to integrate every system you have. Only connect the minimum data needed to diagnose the specific problem you chose in Step 1.
This keeps the project manageable. It also keeps your IT team from killing the project before it starts.
Step 3: Build One Transportation Analytics Dashboard
Create a simple view that shows the reality of your problem.
If it's fuel costs, show cost-per-mile by route. If it's driver behavior, show idling time by driver. Keep it simple. Make it visible.
Put the dashboard somewhere your team can see it every day. Operations can't improve what they can't see. Once the score is visible, people start caring about it.
Step 4: Act on What You Find
Use the data to make one specific operational change.
Let's say your dashboard reveals that three drivers consistently drift off their routes, adding 50 unnecessary miles per week. That's your fix. Reroute those drivers. Coach them. Track the result.
Or maybe your data shows the warehouse isn't releasing loads until 4 PM, causing carriers to sit for hours. Move the pickup window to 2 PM. Measure the detention fees before and after.
One change. One measurement. That's it.
Step 5: Show the ROI
Calculate the savings in actual dollars. Show it to leadership.
"We reduced idling time by 40%, saving $47,000 in fuel costs over three months."
That's the proof you need. Once you show that data saved real money on one problem, you'll have the budget to tackle the next one. Then you repeat the process. Pick the second-biggest problem. Connect the data. Build the dashboard. Fix it. Prove it.
If your TMS is built on Salesforce, you can spin up these dashboards within the hour. Salesforce's native reporting tools let you build and iterate fast, which means you prove value faster. This is how you build an analytics culture without betting the company on an unproven transformation project.
» Want to build these dashboards faster? Learn the advantages of a Salesforce-native TMS
Spot the Problems Before They Cost You
The freight market is likely to stay volatile. Sustainability mandates will tighten. Customer expectations will rise. What's changing is how business and data analytics is changing the transportation industry itself, transforming logistics from a cost center running on gut instinct to a profit center running on intelligence.
Data doesn't replace experience. It amplifies it. And in logistics, where margins live in single digits, that amplification is the difference between profit and loss.
If you want a single, Salesforce-native stack that unifies data, forecasts demand, and automates the boring parts of logistics, schedule a demo to see Neurored TMS & SCM in action.
Schedule your demo today!

Ricardo Medem
Share Article



Let’s Get Started
Schedule a Demo Now