
6 Levels of Satellite Navigation Features for Ships
Most shipping teams can see the vessel.
The problem starts when someone has to decide what that position means for ETA, fuel, carbon, and risk, and they’re doing it with manual checks and stale assumptions. Spreadsheets alone can’t reroute a ship.
Today, the cost of “good enough” planning shows up fast:
- Commercial ratings now depend on routes. CII and EEXI rules tie a ship's route to its charterworthiness. A poor CII score means fewer charters. Route planning is no longer only a question of operations, but revenue.
- Carbon is now a liability. The EU ETS requires verified fuel data for each voyage. Teams that are stuck with estimates are going to have problems.
- Safe routes keep changing. War zones shift, canals close, and insurance boundaries move. Last month's safe route may not work today, so static plans can't keep up.
Given all the problems above, the question isn't "can we track the voyage?" but "can we make decisions fast enough to change the outcome?”
The six satellite navigation features below are how you do that: planned vs actual, weather context, zone logic, and cost per mile. They are all wired into one workflow.
1. AIS Automatically Logs Arrival Times and Flags Fleet Problems
Every team uses an Automatic Identification System (AIS) in day-to-day operations to see their ships, but what creates the real difference is using AIS to stay ahead of any problems that might surface. The best way to do that? Automation.
Modern AIS updates every five minutes via satellite and terrestrial stations. At 12–15 knots, that cadence is enough to spot the signals that matter: a speed drop that hints at engine trouble, a course change that suggests an unplanned stop.
That’s useful, but the real breakthrough is using it to log events automatically. When you combine AIS position with port geofences and vessel status, the system can record operational milestones without anyone watching the screen:
- Port entry
- Anchorage arrival and anchor drop
- Berth arrival / all fast
- Departure and exit
Why does that matter? Because those timestamps become the record, the one that billing, contracts, and claims might argue over. Arrival-time disputes can easily cost thousands per port call. Automatic timestamps reduce that dispute to a simple question: “What does the log say?”
The same automation that prevents disputes also changes day-to-day ops.
Instead of staring at dots on a map, teams work from exceptions. You group vessels by customer, route, charter, or risk profile. The system alerts you when something changes (deviation, delay, unexpected anchorage) and stays quiet when nothing is wrong. The work now shifts from watching the shipment unfold to intervening on time whenever there’s an issue.
Automation also changes how you find capacity. With manual tracking, you’re sifting through calls, emails, asking “what do you have open next week?” With automated tracking you just search. You type “show me vessels headed to Rotterdam next week.” Then you filter by ETA window, draft, vessel type, or last cargo. You get a shortlist in seconds.
The difference is simple:If your timestamps end up in spreadsheets manually, you’re tracking ships. If events flow into workflows automatically, you’ve built an edge.
‣ Learn how proper freight shipment tracking helps your team prevent delays instead of chasing them.
2. Maps That Show Risk Zones, Fuel Boundaries, and War Areas Before You Route
AIS tells you where the ship is. Maps show what's around it, the zones, boundaries, and risks that matter to a route.
That matters because a compliance trigger sitting in a database is easy to miss. If it isn’t seen before the route is approved, it shows up later as cost and rework.
A modern maritime map setup works like a risk and compliance screen. You might get basemaps, including bathymetric options for depth-aware planning and dark modes for 24/7 ops centers. You could even get overlays you can toggle on and off.
With the right layers enabled, constraints sit on top of the route instead of hiding in reference docs. SECA boundaries, MARPOL areas, and Particularly Sensitive Sea Areas become immediate. If the planned track touches a SECA zone, the planner sees it and can adjust early, including legal boundary-skirt tactics that avoid an expensive fuel switch.
Security exposure becomes visible the same way. JWLA zones and piracy regions like the Gulf of Guinea and the Horn of Africa can be assessed during planning, which lets charterers price war-risk insurance before fixture.
Operational constraints benefit too. Traffic Separation Schemes in choke points like the Dover Strait and Singapore Strait show the corridors that matter. Port and anchorage polygons feed AIS event logic (port entry, anchoring, berth arrival) and turn vessel movement into timestamps finance and claims teams can actually use.
Bathymetry is where feasibility becomes obvious. Depth context changes the route options completely depending on draft. A Capesize and a Handymax carrier may each be looking at two different worlds, and the map makes that clear in seconds.
Building this from scratch isn’t easy. AIS data, maps, geocoding, alerts, and compliance workflows all have to work together, and that integration is the hard part.
But that doesn’t mean you need to build a custom mapping stack. Neurored TMS & SCM already covers a lot: AIS vessel tracking, a Control Tower that sends event-based alerts, satellite-powered mapping and and HERE-powered routing & geocoding. It can also pull in external data through standard APIs and data formats.
3. Geocoding That Knows Which Rules Apply at Every Port and Position
A coordinate is just two numbers. It only becomes useful when you know what those numbers trigger; which rules apply, which costs kick in, which limits are in force. Without context, it’s just a dot on a map.
Marine geocoding helps with something that shipping still struggles to this day: location clarity. Port names aren’t standardized in real life. “Jebel Ali” and “Dubai” might mean the same place. Or different terminals. “Saigon” needs to map correctly to modern Ho Chi Minh City codes. These issues are routine in maritime shipping.
A proper geocoding system takes whatever someone enters into the system and converts it into a standardized UN/LOCODE. It’s the five-character identifier recognized by customs, terminals, and finance systems.
It:
- Handles spelling variations and aliases
- Cleans and normalizes the data
- Prevents small naming errors from cascading across operations
That’s the foundation. But the real value isn’t the coordinate itself, but what the location implies.
Take the EU ETS. Emissions are counted at:
- 100% between two EU ports
- 50% when only one port is in the EU
If a destination is automatically classified, carbon exposure is calculated the moment the route is planned. No manual review, after-the-fact correction, or spreadsheet patchwork.
The same pattern repeats across compliance and operations. Entering a SECA zone? You need compliant fuel. Sailing into a JWLA zone? Insurance exposure shifts and breach-of-warranty risks appear.
Even time zones carry cost. If ETA calculations ignore local time, pilot windows are missed, overtime charges increase, and schedules start to slip. These aren’t technicalities. They're direct financial consequences of incomplete location data.
Yes, all of this can be checked manually. You can review charts, cross-reference regulations, and update spreadsheets. But manual verification happens after decisions are made. And in shipping, timing is margin. If geocoding only converts names into coordinates, it’s a reference tool.
If it surfaces the regulatory, financial, and operational consequences of each location automatically, it becomes embedded intelligence. And embedded intelligence changes decisions before they become costs.
‣ Prepare now for digital product passport regulations that will tie compliance proof directly to your cargo
4. Weather Data That Tells You When to Slow Down, Speed Up, or Reroute

Weather is the biggest external variable in shipping. It drives vessel performance, fuel burn, and schedule reliability. Most operators treat it like an unavoidable disruption. The better approach? Treat it like what it is: a measurable routing input.
Modern marine weather APIs don't just tell you "expect storms." They stream dozens of separate data points (wind, waves, currents, visibility, pressure, and more) drawn from NOAA's satellite and buoy network, updated every few minutes, reaching days into the future. That's detailed and fresh enough to make real route decisions instead of rough guesses.
Each variable has an operational consequence. Wave height and swell period increase hull resistance and raise parametric rolling risk. In bad cases, that's how container stacks collapse. Ice thickness decides whether an Arctic or Baltic route is even feasible. Wind and current change speed over ground, which drives ETA and fuel burn.
Those are just the obvious ones. Then there's the underused one: astronomical data.
Many ports enforce daylight-only movements for large vessels or hazardous cargo. If your routing system can query sunrise and sunset (plus dawn and dusk), it can detect when an ETA lands in a restricted dark window. And that changes the decision.
Instead of rushing to anchor and waiting, the vessel can slow-steam to arrive at first light. That's Just-In-Time Arrival in the real world: converting anchorage time into fuel savings.
Weather routing is metocean intelligence overlaid onto the route to answer three questions. Where does resistance spike? Where does safety risk cross your thresholds? Where can speed adjustments turn idle time into savings?
Operators who optimize transportation across a network don't use weather as an excuse. They use it as a constraint and a lever.
5. Routing That Picks the Fastest, Cheapest, and Cleanest Path
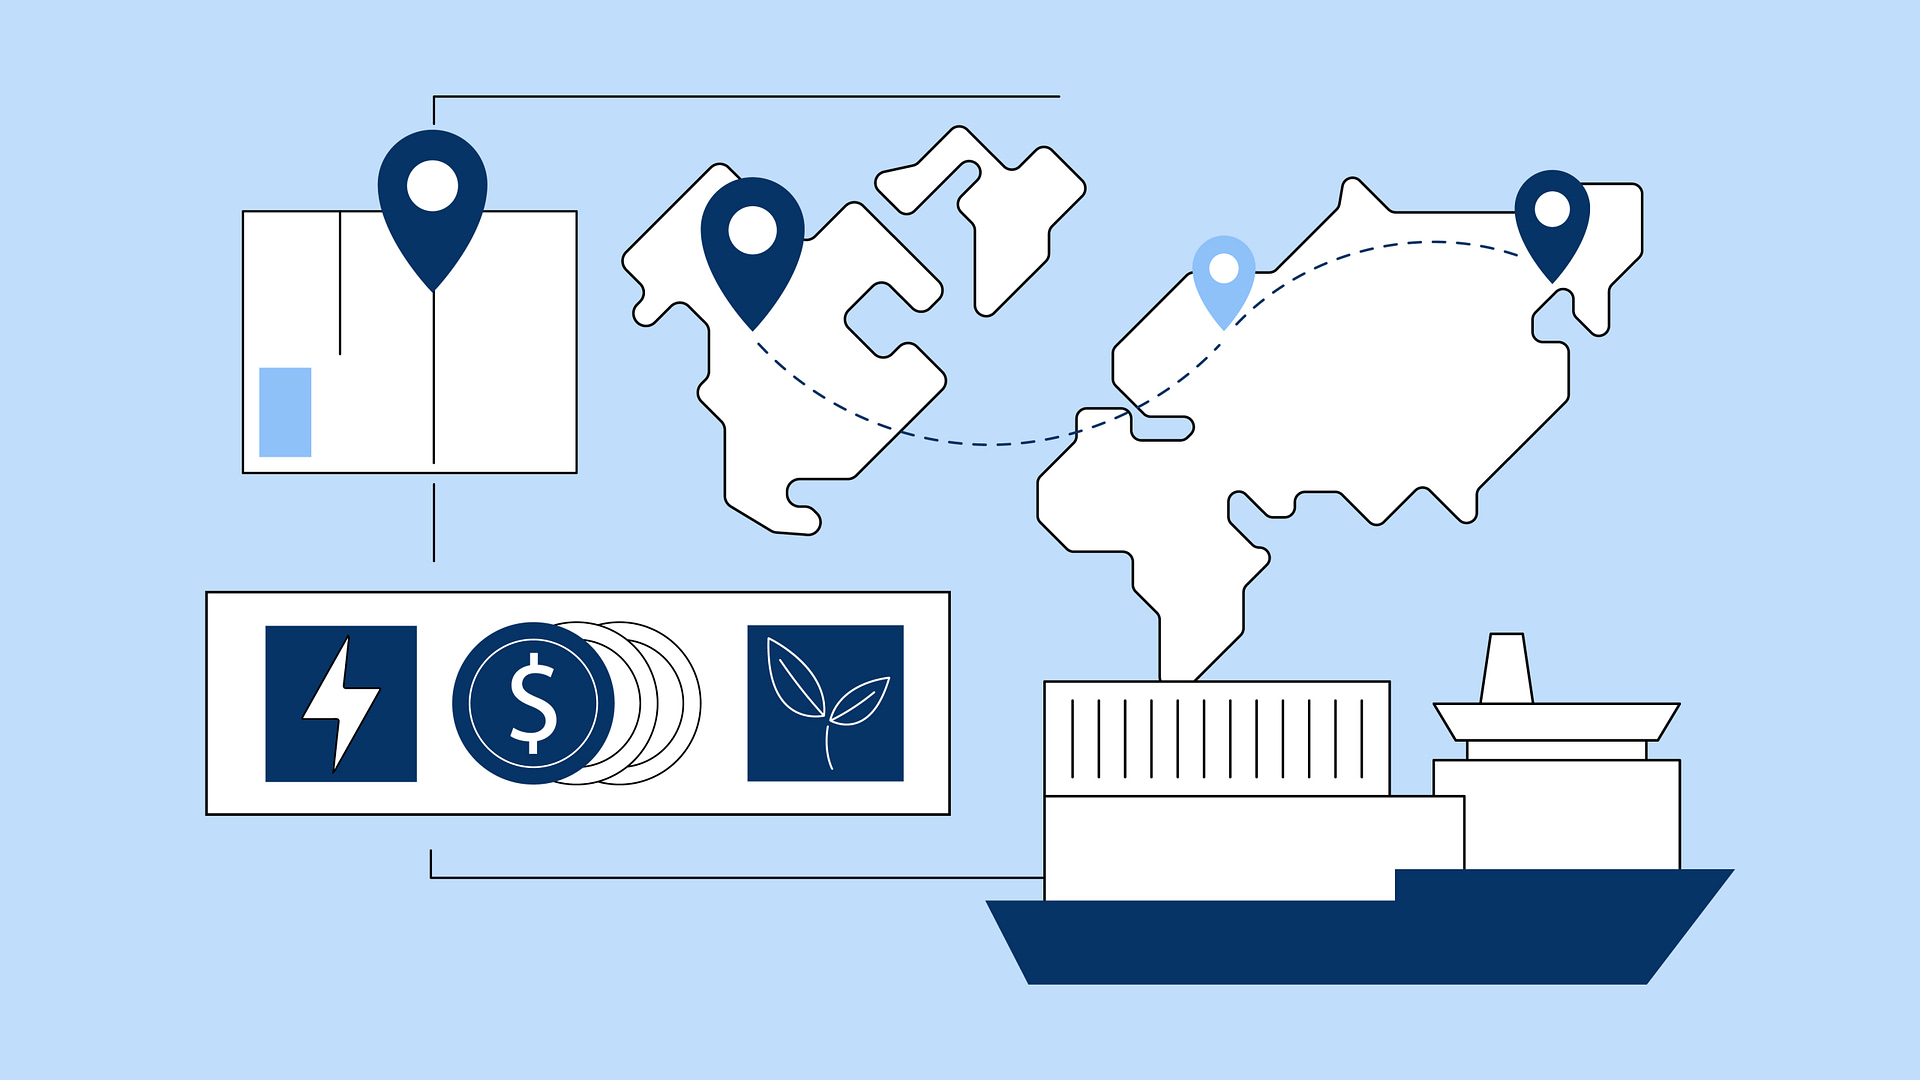
Ship routing is now a commercial tool, not just navigation. A single route decision sets cost, arrival time, legal compliance, and insurance exposure.
Modern routing engines switch methods based on context. Across the open ocean, they use Great Circle paths to minimize distance. Near coastlines, they switch to Rhumb line routing where holding a constant bearing matters more than pure efficiency. The engine never draws a line through land.
The real value shows up when you test scenarios. If you toggle the Suez canal to “closed” and the route swings south via the Cape in seconds, with new distance, time, and fuel burn already computed. Toggle any of 18 canals and straits and watch the numbers change instantly.
These constraints define the model. Draft limits keep deep-hull tankers out of shallow channels. Emission zones force route changes to avoid expensive low-sulfur fuel requirements. Each constraint shapes what routes are legal and insurable, not just possible.
This matters because these outputs drive money. Distance feeds freight payments. Arrival times shape supply chain schedules. Route data flows into pricing models. Routing is pricing.
But algorithms optimize for modeled conditions. Shipping happens in real conditions. They miss currents that don't behave on average, port quirks, informal practices. Experience teaches what datasets can't capture. The captain keeps final authority. And as planned routes meet execution, the system learns where it was right, where it failed, and how to improve next time.
‣ Explore the freight routing challenges compounding costs today and the trends reshaping how operators respond
6. Carbon Math That Shows Your EU ETS Bill Before the Voyage Ends
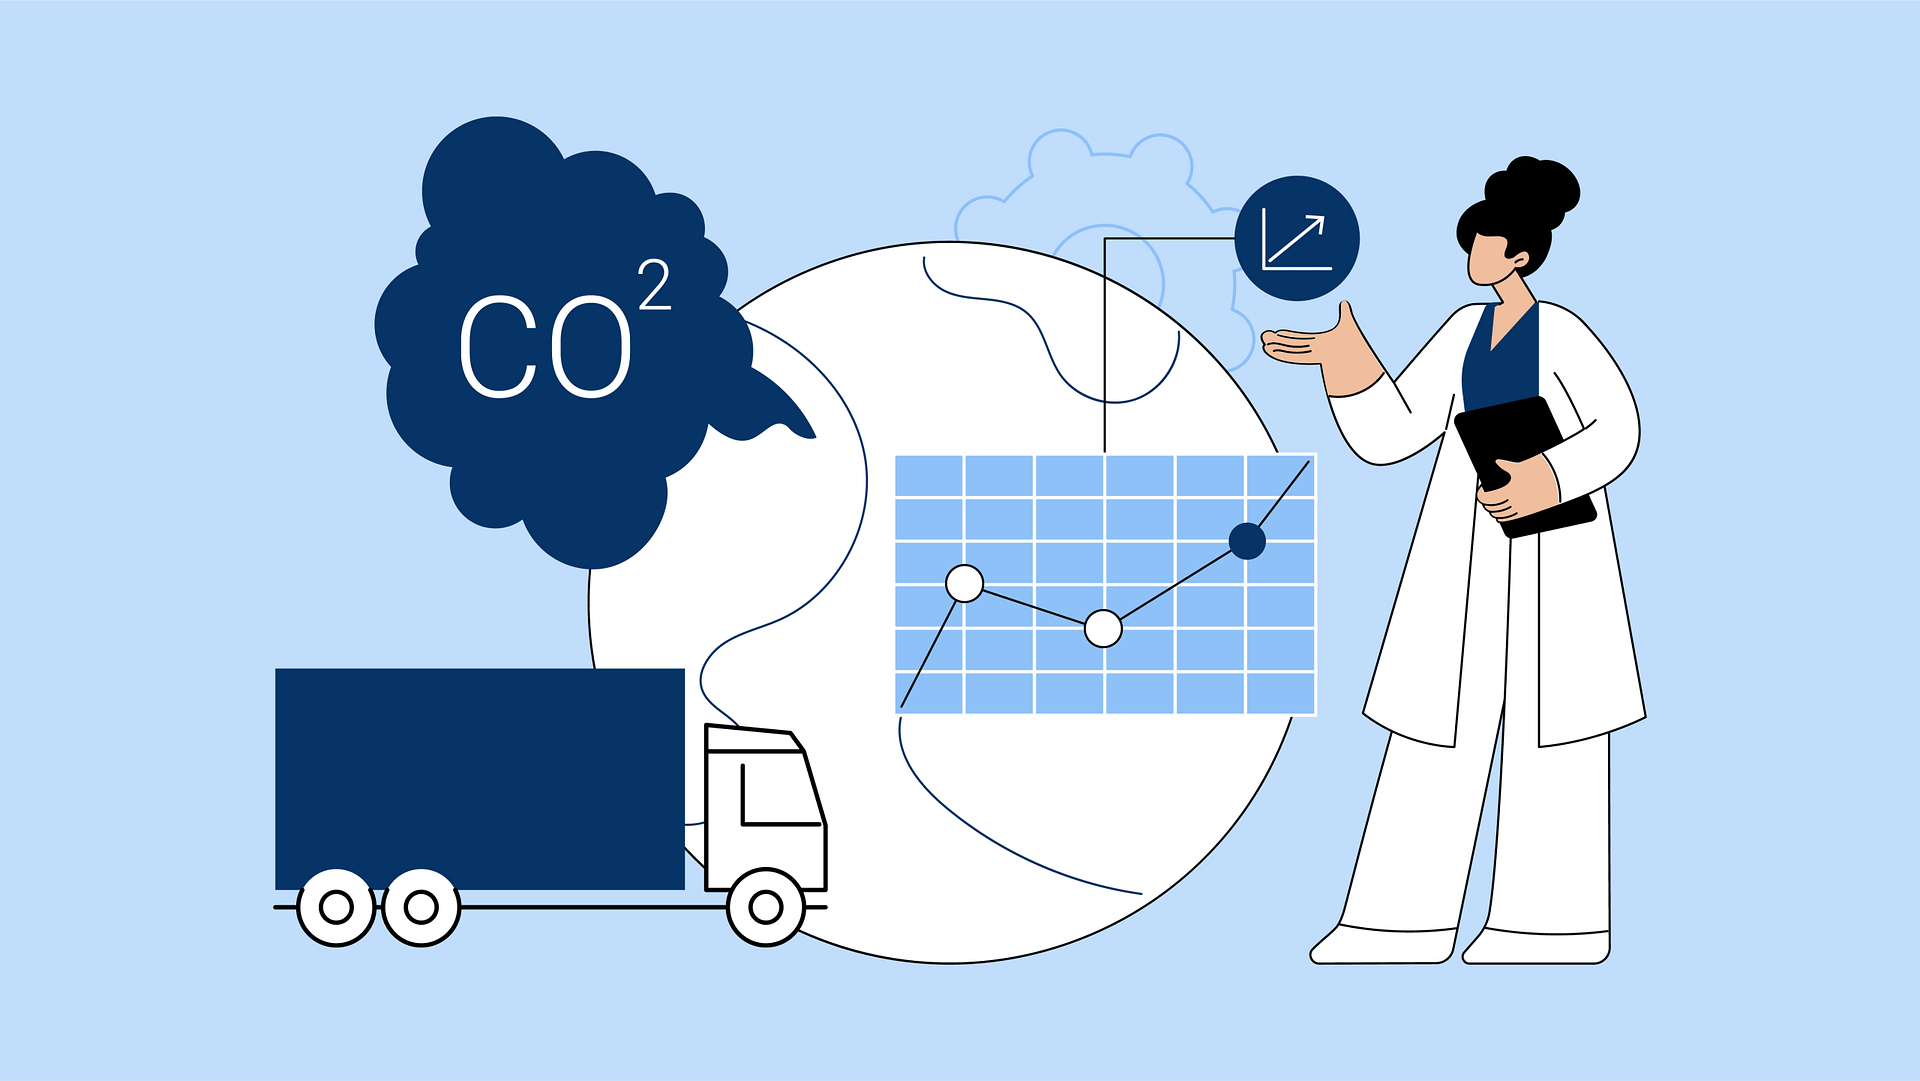
Carbon emissions are now a financial liability. Under the EU ETS, operators buy allowances for every liable voyage, and that cost hits the balance sheet as a tangible expense that rises as regulations tighten.
Precision matters because emissions depend on the operating state. A laden hull burns differently than a light ship. An engine idling in port has a different profile than one pushing through open water. Weather changes everything: storms force engines to work harder, extend passage time, and push consumption past calm-water projections. That's where budgets break.
The calculation gets harder because fuel isn't uniform. Different fuels carry different carbon factors and different prices. SECA zones force sulphur restrictions that change which fuel you can burn and what it costs. Every choice compounds into the final number.
That number determines your CII rating. Ratings run from A to E, and a drift from B to C costs you deals. Charterers won't touch a vessel sliding into D territory. Real-time tracking catches the slide early so you can fix it before it kills business.
The same tracking calculates EU ETS exposure, builds the audit trail regulators demand, and connects operational choices directly to carbon cost. Speed decisions, route selection, waiting time, all of it flows into one liability figure.
Route comparison becomes cost comparison. Suez versus Cape isn't about nautical miles. It's fuel, time, and carbon liability merged into a number you can price and explain. Cargo owners tracking Scope 3 emissions now demand this visibility. Charter desks that deliver it win.
‣ Discover how bunker procurement optimization can turn your fuel planning into a live decision model that recalculates mid-voyage
How These Six Features Work as One System
No single capability here wins on its own. AIS without geocoding is tracking without context. Routing without weather is optimization against a static world. Carbon accounting without zonal intelligence is liability guesswork. The value emerges when they connect into a feedback loop.
Routing creates the planned layer. AIS creates the actual layer. The gap between them is where improvement happens, but only if you understand what caused the gap. Weather explains what changed in the environment. Maps show where spatial risks appeared. Metrics translate the divergence into financial and regulatory consequences.
When you compare those layers, you get a learning mechanism. The planned route predicts time, fuel, and compliance exposure. The actual track shows what really happened. Weather data explains why conditions diverged from forecast. Zonal overlays show which rules applied where. Emissions and cost calculations turn those deviations into measured liability. The system now has what it needs to improve its next prediction.
If a vessel consistently underperforms routing forecasts in specific sea states, its performance profile adjusts. Future predictions stop treating it like an average hull and start modeling it as that specific vessel under those specific conditions. Prediction accuracy improves, which improves decision quality, which improves margins.
That closed loop separates organizations that have data from organizations that can act on it. It also produces the audit trail the market now demands: not just what happened, but what was planned, what changed, and why.
‣ Build a logistics stack that adapts instead of breaks by future-proofing your freight forwarding operations now
When This Approach Delivers the Highest ROI
This approach doesn't deliver equal value everywhere. The ROI is highest where uncertainty is expensive, such as:
- High-variability corridors and choke points where disruption is routine create constant replanning costs.
- Tight schedules where ETA uncertainty triggers demurrage, overtime, or lost production slots turn forecast errors into direct losses.
- High zone exposure trades (SECA, EU ETS, war-risk) make zone-aware routing a cost reducer, not a nice-to-have.
- Carbon-sensitive operations where CII and emissions performance influence fixture decisions face commercial pressure that visibility can relieve.
The Infrastructure That Makes Satellite Intelligence Work
Satellite intelligence only delivers value if your systems can act on it. Four requirements determine whether that's possible:
Unified Data
The infrastructure should deliver decision-ready signals, not raw satellite feeds. A vessel-side stack that aggregates and harmonizes multiple satellite and data providers is complex, brittle, and resource-intensive. The winning approach is to use platforms that already integrate with leading providers and deliver structured outputs directly into your TMS workflows.
Connected Workflows
The system must consume structured satellite feeds and automatically trigger downstream actions; recalculated ETAs, updated fuel orders, and revised berth bookings. Without automated workflow triggers, satellite data becomes reference information instead of operational infrastructure.
The Right Setup for Each Route
Infrastructure should scale to route complexity. High-exposure trades (SECA zones, EU ETS liability, war-risk areas) need the full stack: real-time carbon accounting, dynamic rerouting, compliance automation. Short-sea shuttles with fixed schedules need simpler implementations. Match infrastructure investment to operational exposure.
Decision Oversight
Clear decision rights and override protocols ensure the system learns from exceptions. The infrastructure must capture when human operators override routing recommendations, document the reasons, and feed those decisions back into the optimization model. Without governance, overrides disappear into email threads and the system can't improve.
‣ Find out more about the advantages of a Salesforce-native TMS
What Happens When You Understand the Ocean
Satellite navigation isn't tracking anymore. It's the infrastructure that turns what's happening on the water into decisions that change P&L outcomes.
The operators winning today aren't the ones with better dashboards. They're the ones whose systems act on satellite data automatically, before the window to change the outcome closes track their vessels’ voyage.
Neurored TMS & SCM connects satellite intelligence directly to Salesforce workflows. Route changes automatically trigger ETA updates, fuel orders, berth bookings, and carbon reports, eliminating manual coordination across disconnected systems
Interested in how Neurored TMS & SCM turns satellite data into operational decisions? Schedule a demo to explore how the platform handles your specific routes, compliance exposure, and carbon reporting requirements.
Disclaimer: This article contains forward-looking statements regarding a proposed operating model that involves risks, uncertainties, and assumptions. These statements refer to the integration of currently available capabilities, including but not limited to satellite tracking, routing engines, metocean data, carbon accounting, and spatial intelligence.
While the underlying mechanics described herein do not require the discovery of new physical principles ("new physics"), the realization of this future state is dependent upon assumptions regarding integration maturity and operating discipline.
Schedule your demo today!

Ricardo Medem
Share Article



Let’s Get Started
Schedule a Demo Now