
Fleet Route Optimization Guide: Plan Smarter Routes & Boost Productivity

There's a common misnomer in fleet route management: that somewhere, buried inside enough data and compute power, the perfect path exists. You just need the right software to find it. It's a comforting fantasy. And it almost never survives first contact with a loading dock.
The Vehicle Routing Problem (VRP) has been studied for decades. In the research world, it's a clean puzzle. Perfect distances, static maps, drivers who follow instructions like robots. Researchers compete to close the gap to a theoretical ideal by fractions of a percent.
But real fleets don't work that way.
Road networks shift by the hour. Customer locations don’t point to the actual delivery entrance. Addresses are messy. Travel times are unpredictable. And drivers know things the software doesn't. They have the good sense to ignore a turn-by-turn instruction when they know better.
We wrote this fleet route optimization guide on the premise that fleet route optimization isn’t about finding the shortest path. It’s about building a reliable system that lowers the total cost of execution.
What Is Fleet Route Optimization?
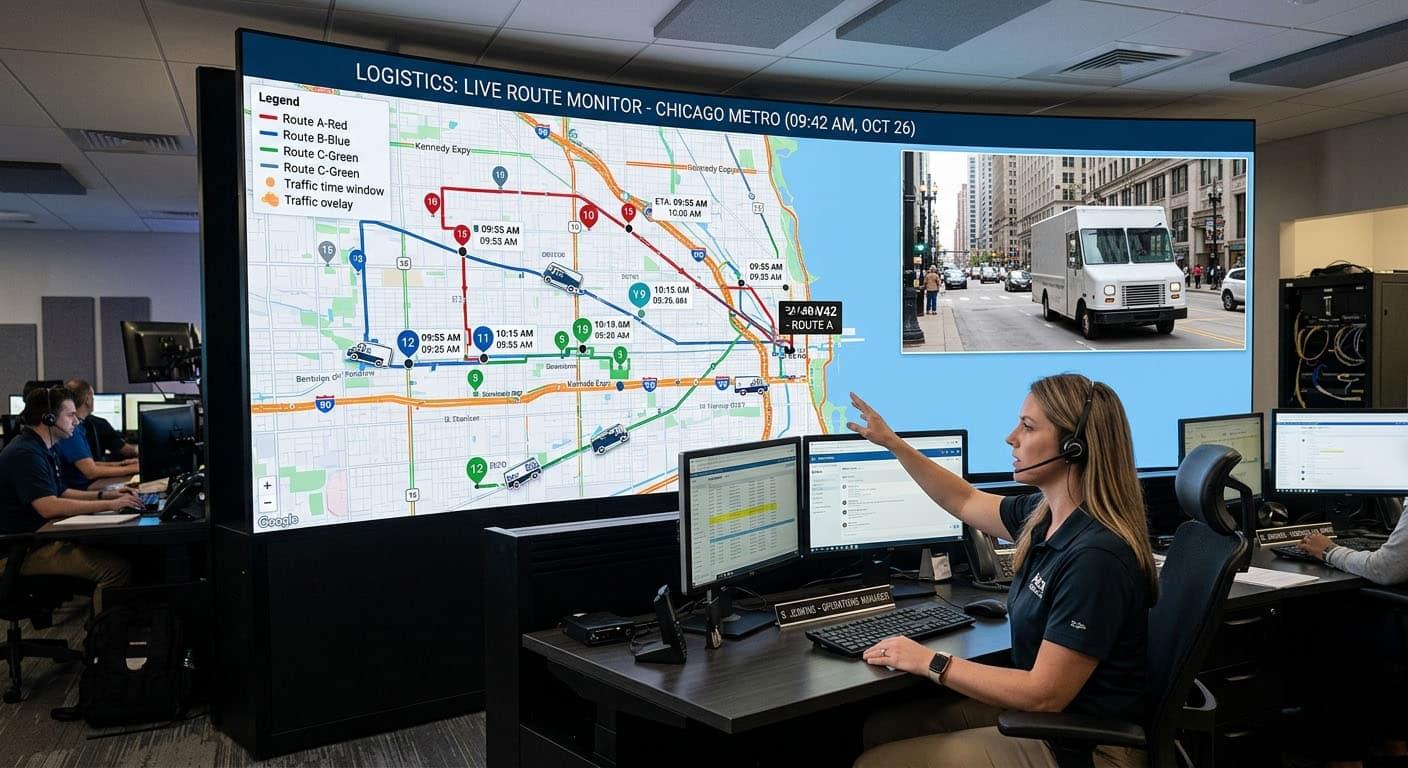
Fleet route optimization is the process of assigning stops to vehicles and sequencing those stops to minimize total cost: fuel, labor, service failures and rework.
It accounts for real-world constraints like delivery time windows, vehicle capacity, driver shift limits and equipment requirements like liftgate trucks. As fleets scale beyond a handful of vehicles, manual planning breaks down fast. That's where systematic optimization becomes the difference between profitable and unprofitable operations.
It's easy to misunderstand what fleet routing optimization actually is. So let's clear up three things before we go further:
- It's not "Google Maps but for fleets." Consumer navigation optimizes a single trip. Fleet route optimization assigns hundreds of stops across multiple vehicles at the same time, balancing competing constraints.
- It's not "AI finds the perfect route." Mathematically, this problem is one of the hardest in computer science. As stop counts go up, the time to find a provably optimal solution explodes. Every software uses shortcuts that find reliable solutions, not perfect ones.
- It's not a one-time plan. Fleet routing optimization is continuous decision-making. The plan you dispatch at 6 AM will not be the plan your fleet executes by noon.
‣ Understand what top-performing fleets are doing differently in 2026
The 4 Data Foundations That Make or Break Fleet Routing
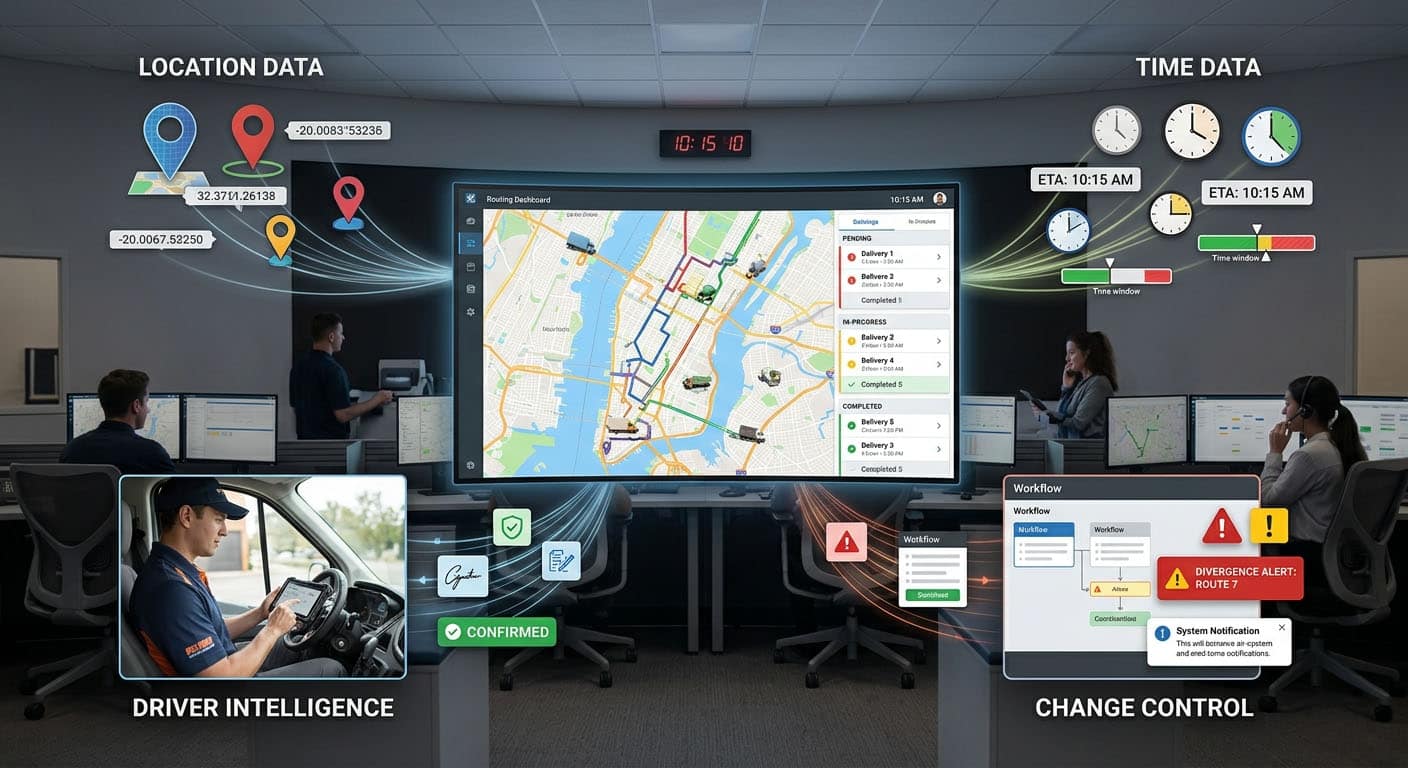
Route optimization software gets most of the attention. But the research is consistent: the failure mode in fleet routing is almost always data quality, not software quality. A perfect algorithm fed bad inputs produces operationally useless routes.
Before you build a playbook, get these four inputs right.
Foundation 1: Location Data
Mailing addresses point to mailboxes, not loading docks. The actual delivery entrance might be hundreds of meters away, on a different street, and a single bad geocode can add minutes of searching per stop. Because routes are sequenced to the minute, one miss cascades through the entire schedule.
The fix is structural. Maintain separate vehicle access points (where the truck stops) and human access points (where the recipient is), and build a correction loop so driver-reported fixes become approved master data rather than one-off notes lost in a group chat.
Neurored TMS & SCM supports this process by centralizing location data and exception capture within transport order records, turning corrections into reusable routing inputs.
‣ Check whether your real-time tracking can support reliable routing decisions
Foundation 2: Time Data
Static averages ("assume 30 mph," "15 minutes per stop") will break routes by mid-morning. Unloading at a suburban dock with a clear bay takes a fraction of the time it takes downtown with no loading zone and a mandatory sign-in, and that variance compounds across a full route.
The teams that hit their windows consistently define service-time standards by stop type, update them monthly with actual execution data, and treat weather and seasonality as real inputs rather than edge cases. Tracking planned versus actual arrival times is what turns this from a one-time setup into a system that improves every cycle.
Foundation 3: Driver Intelligence
Amazon's Last Mile Research Challenge found that experienced drivers frequently outperformed software-generated routes. They clustered walking loops from single parking spots, avoided unsafe turns, and used parking knowledge the algorithm lacked. These deviations were not errors but rational optimizations based on tacit knowledge the software did not have.
You can start capturing this value by using structured reason codes when drivers deviate ("no parking," "wrong entrance"), penalizing known bad transitions in the optimization matrix, and using high-performer patterns as starting points for the software.
Neurored TMS & SCM Trucking Software supports this process by letting operators assign orders based on driver performance ratings and historical performance by sector, so institutional knowledge shapes dispatch decisions rather than disappearing when experienced drivers leave.
Foundation 4: Change Control
If the software re-optimizes every time something changes, routes shift so often that drivers stop trusting the plan. The research calls this system nervousness, and it destroys execution quality faster than a suboptimal route ever could.
The fix is to include an inconvenience penalty so changes only happen when the projected savings clearly justify the disruption. Neurored TMS & SCM helps teams connect transport records, dispatch workflows, and exception handling inside one operational system, with approvals and audit trails for better control.
A Fleet Routing Playbook You Can Implement
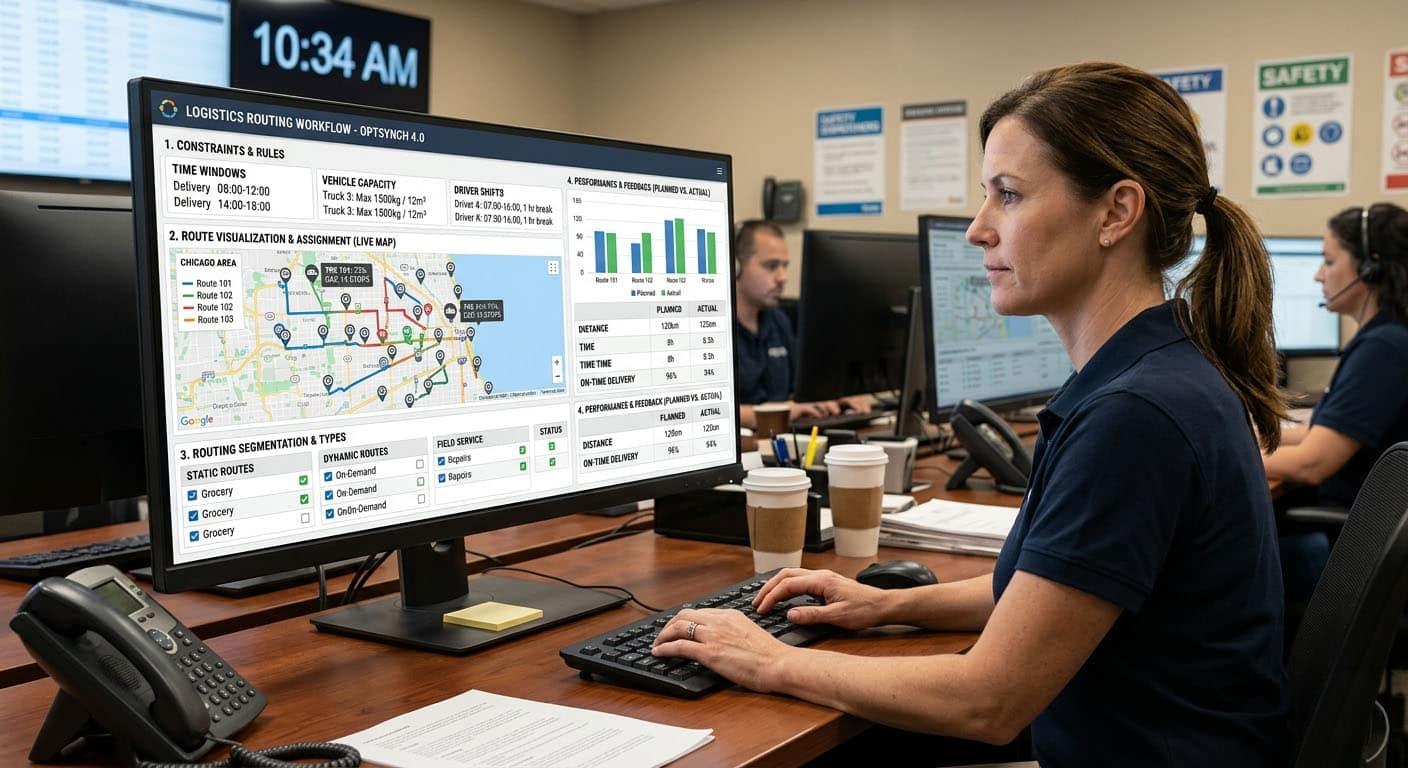
Step 1: Define Your Constraints Before You Chase Savings
Before you touch a software or evaluate a vendor, inventory every constraint your routes must respect. Time windows, maximum shift length, mandatory break periods, vehicle capacity, depot return rules, driver skills, vehicle-type restrictions. Write them all down.
The most common mistake in fleet route planning? Optimizing for distance first and retrofitting constraints afterward. This produces routes that look efficient on paper but violate labor laws, exceed vehicle weight limits, or require driver skills that aren't available on the scheduled shift. The result is rework, overtime, and ad-hoc dispatching.
Here's why this matters. A constraint-unaware optimizer will chase the shortest path through stops. A constraint-aware optimizer will find the shortest feasible path. Those two routes often look very different. But only one of them is actually executable.
‣ Learn how to implement advanced freight routing systems
Step 2: Segment Your Routing Problems
Not all routes are the same. Most fleets run a mix of these, and each one demands a different optimization strategy:
|
Routing Type |
Primary Priority |
Re-optimization Cadence |
Best For |
|
Static milk runs |
Route stability |
Weekly |
Recurring delivery networks with predictable volumes |
|
Multi-drop distribution |
Time window compliance |
Daily (morning dispatch) |
High-density delivery with tight customer windows |
|
Field service |
Skill matching and appointment adherence |
Event-driven (on new jobs) |
Technician dispatching with specialized skills |
|
Dynamic same-day |
Responsiveness and speed |
Continuous (per order batch) |
E-commerce, food delivery, on-demand logistics |
Treating all of these the same, with a single optimization cadence and cost function, guarantees suboptimal results across the board.
‣ Explore the different types of freight routing
Step 3: Pick the Right Optimization Cadence
How often should you re-run your fleet route planning cycle? It depends on your operational volatility and your customer promises:
- Plan once daily works for stable distribution networks with known stop lists and predictable volumes. Run the software overnight or early morning, dispatch the plan, manage exceptions manually.
- Rolling re-optimization every N minutes suits operations with moderate change rates. The software snapshots current conditions and re-solves periodically. This works, but it introduces more plan volatility.
- Event-driven re-optimization is the best approach for stability. The software only re-plans when something meaningful happens: a vehicle reports a significant delay, a new high-priority order arrives, or a stop cancels. This minimizes unnecessary plan changes while still responding to real disruptions.
Remember to match your cadence to the problem segment we mentioned in the last step. Static milk runs might re-plan weekly. Dynamic same-day operations might re-plan on every new order batch. The mistake is applying one cadence across the entire fleet.
Step 4: Build the Feedback Loop That Compounds Savings over Time
This is the most underrated advantage in fleet route optimization. And most teams skip it.
Every dispatched route generates data: planned vs. actual arrival times, driver deviations, service-time variances, exception events. The companies that systematically capture this data and feed it back into their routing inputs will be able to pull further ahead every quarter.
The flywheel works like this
- Planned routes produce actual execution data
- Exceptions get captured and root-caused
- Root causes drive data fixes (corrected geocodes, updated service times, new cost penalties)
- Better data produces better plans in the next cycle
Every week, track your top 10 failure modes, such as geocodes, service-time misses, late departures from the depot, constraint violations.
Rank them by frequency and cost. Fix the top three. Repeat. Remember that this flywheel only works if planned-vs.-actual data and exceptions are captured consistently.
A control tower layer like Neurored’s Supply Chain Control Tower can help you monitor exceptions, surface performance patterns, and report on operational metrics without stitching the picture together manually each week.
‣ Identify which routing approach matches your operational constraints
The KPIs That Separate Real Optimization From Expensive Rearranging of Stops
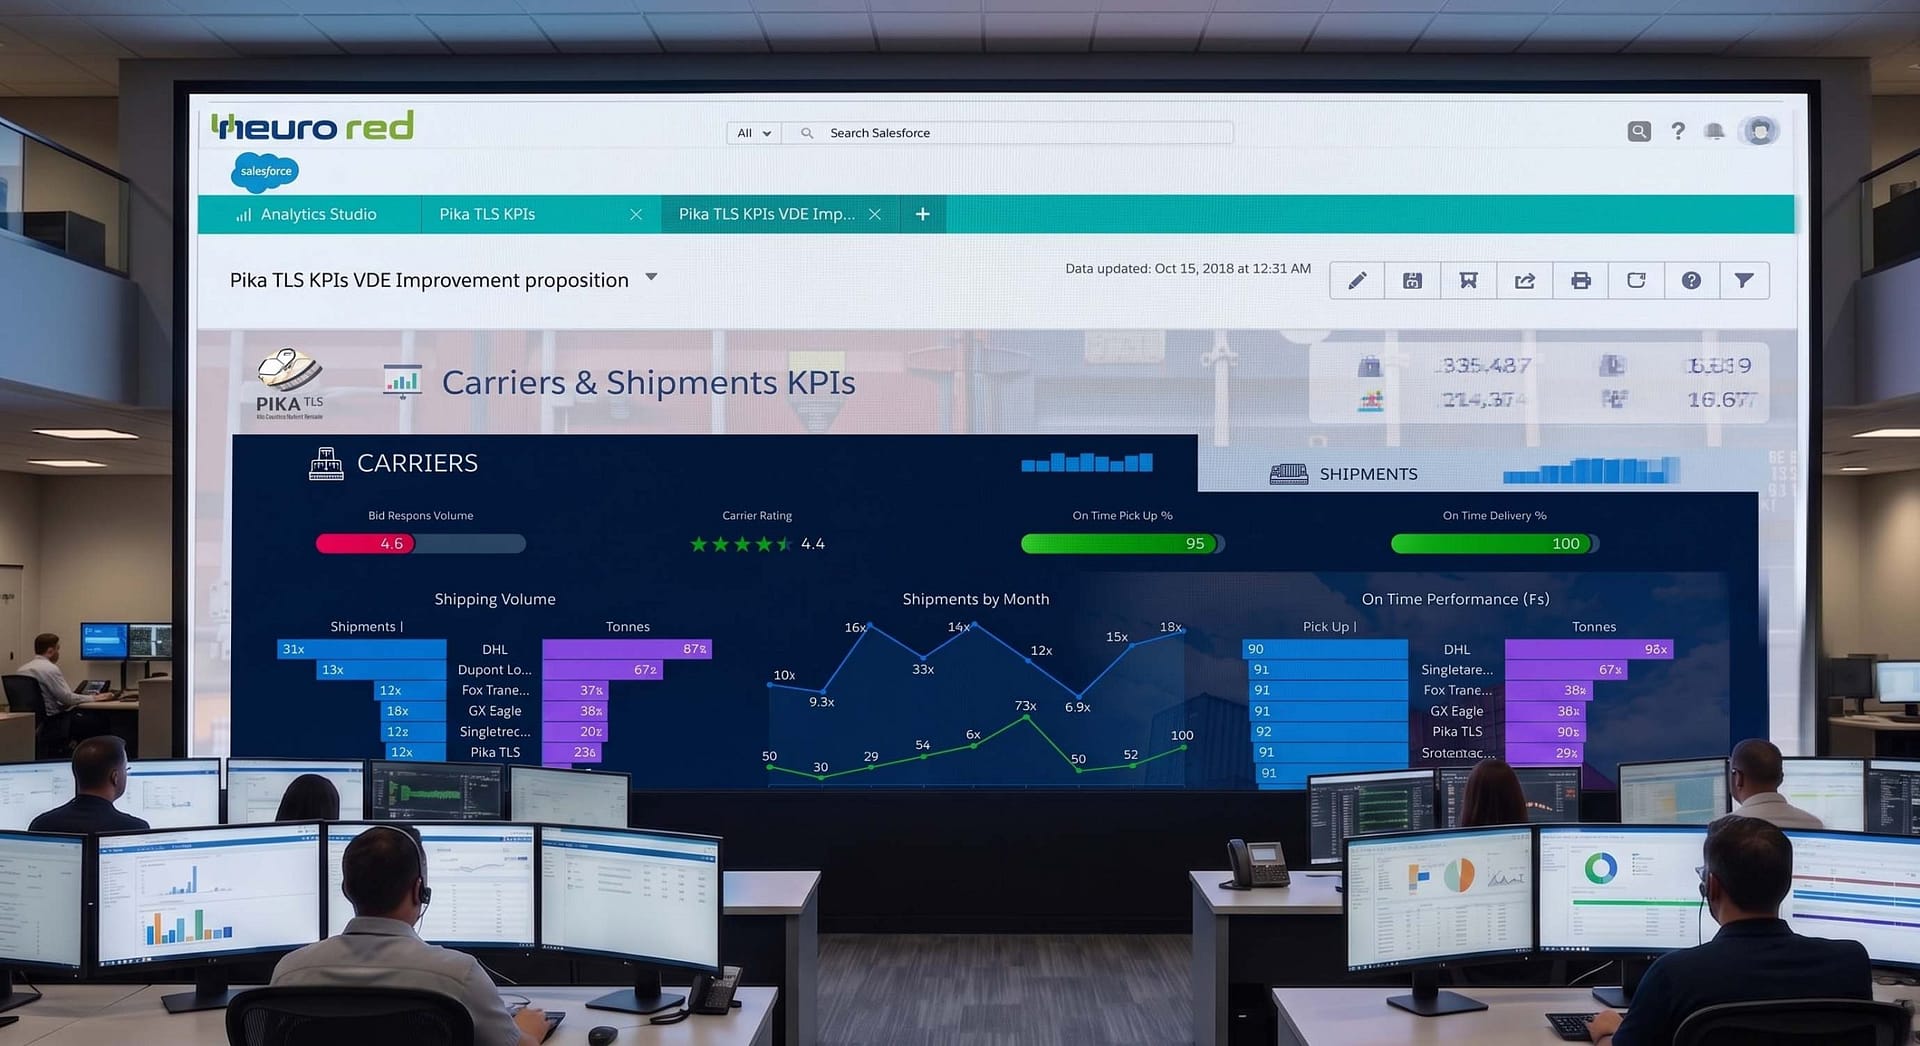
Good fleet route management comes down to what you measure. Most teams over-index on cost metrics and ignore the stability metrics that tell you whether your plans are holding up in the field.
Cost and Productivity
Most teams already track these. But it's worth listing them to make sure you're capturing the complete picture:
- Fuel cost per kilometer
- Kilometers per stop
- Stops per hour
- Drive-time to service-time ratio
- Overtime hours
- Route completion variance
- Late-window rate
The drive-time to service-time ratio deserves special attention because it is one of your best diagnostic metrics. If your drivers spend more time driving between stops than servicing them, your routes are probably too spread out or your stop assignments are poorly clustered.
Reliability and Stability
These metrics tell you whether your optimization is creating stable, trustworthy plans or just reshuffling stops in impressive-looking ways.
- Plan adherence (%): the percentage of stops executed in the planned sequence. Low adherence means either the plan is unrealistic or the driver doesn't trust it. Both are problems.
- Re-optimizations per route per day: more is not better. Each re-optimization introduces potential instability. Track this to see if your cadence is creating value or noise.
- Thrash rate: stops resequenced after dispatch. A high thrash rate signals that your pre-dispatch data (ETAs, service times, constraints) isn't reliable enough for the software to produce stable plans.
- Exception density by customer or site: some locations are chronic problem points. Bad addresses, unpredictable access, long dwell times. Identifying them lets you fix the root cause rather than absorbing the cost every cycle.
Taken together, these are execution-stability metrics. They show whether your optimization logic is producing plans that drivers can actually follow. And they show where the instability is really coming from: bad inputs, weak constraints, dispatch churn, or recurring site-level exceptions.
In Neurored TMS & SCM, the relevant execution signals, including route adherence monitoring, driver/location tracking, order and exception management, and transportation analytics, can live in the same platform, making those root causes easier to spot and fix.
Customer Experience
These are the metrics your customers feel:
- On-time delivery rate
- Failed first-attempt rate
- Dwell time at stop
- ETA accuracy
That last one is worth watching closely. Inaccurate ETAs, even when the delivery arrives "on time" by the original window, erode trust. They generate unnecessary "where is my delivery?" calls that eat up customer service resources. Your delivery might technically be on time. But if your customer spent the morning wondering, you've already lost something.
The Mistakes That Kill Fleet Route Optimization & How to Fix Them

It's easy to blame the software when routes fall apart. But failure almost always starts upstream. In the data. In the assumptions. In the process wrapped around the technology.
Trusting Your Geocodes
Research by Cayo and Talbot found that standard street-centerline geocoding placed 95% of urban addresses within 152 meters of their true location, with errors ballooning to over 400 meters in suburban areas and nearly 3 kilometers in rural ones. Even using the more accurate parcel-point method, 5% of urban addresses were still off by more than 21 meters.
Standard geocoding points to a mailbox or a parcel center, not a loading dock. The actual delivery entrance might be hundreds of meters away, on a different street. A single bad geocode can add minutes of searching per stop. And because routes are sequenced to the minute, one miss cascades into every stop that follows.
The fix: maintain separate vehicle and human access points, and build a correction loop where driver-reported fixes become approved master data, not one-off notes.
But that loop only works if drivers can submit corrections from a mobile device in a few taps. Not by calling dispatch. Not by typing into a chat thread. Without low-friction capture at the point of delivery, the data never makes it back.
Neurored’s DriversON Mobile App helps close that loop in the field. Drivers can capture delivery notes, photos, signatures, and other proof-of-delivery updates on mobile, even when connectivity is limited, and sync those updates back into the same operational system used for transport orders and exception management.
‣ Want to always know where your cargo is? Master freight shipment tracking
Using Flat Averages for Travel and Service Times
Miscalculations are costly. A route built on flat averages looks efficient on screen. In the real world, variance between stops compounds across the full schedule. One unrealistic assumption at stop three means every stop after it is running behind.
To fix this, you can define service-time standards by stop type. Update regularly from actual execution data. Treat weather and seasonality as real inputs, not edge cases.
For teams that lack the bandwidth to run that analysis by hand, a control tower view that aggregates execution data across modes turns this from a periodic spreadsheet project into a continuous, automated input.
‣ Planned vs. actual gaps close with better data. Learn how to manage yours in our guide to transportation data analytics
Ignoring What Drivers Know
Amazon's Last Mile Research Challenge found that experienced drivers frequently outperformed software-generated routes. They clustered walking loops. They avoided unsafe turns. They used parking knowledge the algorithm didn't have.
Beryl Tomay, Amazon’s vice president for Last Mile Delivery, acknowledged the problem, saying “Despite the tremendous advances in routing optimization over the last decade, there remains an important gap between periodic route planning and real-time route execution.”
Here’s a fix you can implement: capture structured driver feedback with reason codes, penalize known bad transitions in the optimization matrix, and use high-performer patterns as starting points for the software
Re-Optimizing Too Frequently
Constant re-planning causes "system nervousness," where routes shift so often that drivers lose trust and start freelancing.
The fix is to implement a frozen zone. Lock the next 10 to 15 minutes of each route. Only reassign stops when the projected improvement clearly justifies disrupting the driver's committed plan, or when holding the current plan risks a specific SLA breach. I
f neither condition is met, the instability costs more than the savings.
If you want to reduce routing instability, Neurored Multimodal Transportation Management Software provides the operational foundation: dispatch planning, order records, exception management, workflow approvals, and audit trails in the same platform.
That makes it easier to apply disciplined re-planning rules and review when route changes added value versus avoidable noise.
No Fallback When the Optimizer Fails
DoorDash's dispatch system includes a greedy route optimization fallback for exactly this reason. If the primary process stalls, a simpler algorithm takes over instantly. Without that safety net, one edge case means a manual dispatch morning.
Here’s the fix: make sure your routing tool uses tiered decisioning, with a fast heuristic for immediate decisions, background improvement passes, and guardrails during execution.
Measuring Distance but Not Stability
If your dashboard shows average route miles but not plan adherence, thrash rate, or re-optimization frequency, you're measuring the output without measuring whether it's actually executable.
To fix this, you can add plan adherence (%), stops resequenced after dispatch, re-optimizations per route per day, and exception density by site to your reporting.
How to Evaluate Route Optimization Software

If you're responsible for routing transportation, every vendor you talk to will tell you their software is "AI-powered." That phrase, on its own, tells you almost nothing.
Here's what to actually ask them.
Ask Where They Use Machine Learning, Not Whether They Do
The core optimization engine in virtually every commercial routing tool is a heuristic search method, not a neural network. It builds a starting plan, tears part of it apart, rebuilds it better, and repeats that cycle thousands of times in seconds.
This approach (Adaptive Large Neighborhood Search) is the industry standard. It powers DoorDash's dispatch system and open-source engines like GraphHopper and Nextmv. There is no meaningful differentiation between vendors at this layer.
Where machine learning does make a measurable difference is in the inputs the engine receives. The best systems use ML to predict travel times from historical GPS traces, time-of-day patterns, and weather, rather than relying on static map distances.
They also estimate realistic service times by stop type (a suburban dock versus a downtown building with no loading zone) instead of using flat averages. Better inputs produce better plans regardless of which software runs underneath.
‣ Discover what’s new in Neurored TMS 4.0, an AI-powered multimodal logistics software
Ask What Happens When the Software Fails
A routing engine that crashes or times out at 5 AM means someone is building routes by hand. Mature systems use tiered decisioning: a fast fallback heuristic produces a workable plan immediately, while the full optimization engine improves it in the background.
DoorDash's system, for example, reverts to a greedy algorithm whenever the primary software encounters latency spikes. If a vendor can't explain their fallback logic clearly, that's a red flag.
Ask How They Handle Plan Stability
Constant re-optimization causes route thrash. Look for systems that implement frozen zones (locking the next 10 to 15 minutes of each route) and penalty terms that reject marginal changes unless the projected savings clearly justify disrupting a driver's committed plan.
‣ Compare the tools that actually improve routing performance in production
The Goal Isn’t the Best Route. It’s the Best System.
The companies that consistently get value from fleet route optimization aren't running the most sophisticated algorithm. They're treating routing as a system. Clean data feeding a reliable software, whose output accounts for how drivers actually operate, whose execution generates feedback that makes the next plan better.
That's the flywheel. And it compounds. If you want savings that stick, start with clean execution data and disciplined change control. Then let the software do its job.
That is where Neurored TMS & SCM fits: helping teams connect orders, execution, exceptions, and performance data in one operational system, so each routing cycle starts with better information than the last. If you want route optimization savings that hold up in real operations, schedule a demo to see how Neurored TMS & SCM supports that loop.
Schedule your demo today!

Ricardo Medem
Share Article



Let’s Get Started
Schedule a Demo Now